INTRODUCTION
Nature and Importance of the Study
Probiotics is a term which means “for life” and defined as live microorganisms that beneficially
affect the host by improving the balance of the intestinal micro flora”. It is commonly used to refer to “good
bacteria” that one has to have in the body in order to maintain a healthy immune system. Mc Cann et al., (2004)
There are over 400 different known species of bacteria that inhibit the normal bowel-excluding viruses,
yeast and parasites. To put it in another way, there are 20 times more bacteria in the body than there are in cells. And more
than the total number of people who in the gut is very important since the intestinal tract is home to some 100 trillion microorganisms,
but only a few of them are friendly. Mc Cann et al., (2004)
Research suggests these benefits are due in part to the effect s probiotic bacteria have on a wide
range of intestinal functions. Several types of probiotic culture (Lactobacillus casei, Lactobacillus acidophilus, Lactobacillus
plantarum, Bifidobacterium) are being introduced in an expanding variety of dairy product round the world. Daily consumption
of probiotic foods, such as yogurt and cultured dairy drinks, may be beneficial in one of several ways. Gill et al (2004).
Some of these probiotics help strengthen the body’s defenses by providing a regular source of
probiotic bacteria for the intestinal tract; some might provide a much needed calcium for individual who are unable to consume
most dairy foods because of lactose intolerance; and some may help to correct a potential balance of the intestinal microflora
Adofsson, et.al, (2004). Several studies have shown that regular consumption of some probiotics helps maintain the balance
of the intestinal microflora which can have a wide range of beneficial effects.
The use of growth- promoting antibiotics is being placed under more and more pressure as consumers
increasingly fear that their use in feed ration of productive livestock lead to the formation of resistance against bacteria
which are pathogenic to humans. Simultaneously, the adverse effect of antibiotic feeding has encouraged a shift In favor of
feeding probiotics to be used exclusively as growth stimulants and for improvement of the feed conversion rate to boost up
productive performance of chicken Langhout, (2000).
Poultry nowadays are are raised for intensive production system in densely populated flocks. During
this process, chicken may get stress from a number of factors such as overcrowding, unfavorable ambient, feed intake and vaccination.
The dietary use of probiotics feeding is gaining momentum in broiler to counteract and to minimize the stresses Cavazonni,
et. al, (1998)
The biggest challenges still arise in determining the correct type and quantity of probiotics because
of the number and diversity of microbes and the poorly understood interaction between the microbes and intestines. Hence,
this study will be conducted to find out the influence of the different kinds of probiotics, L. casei, L. acidophilus and
L. plantarum as feed supplement for broilers.
The result of this study will help the researcher and other neighboring communities to have adequate
knowledge and genuine information on the uses of these probiotics as feed supplement
Objectives of the Study
Generally, this study aims to find out the effects of the three (3) kinds of probiotics, Lactobacillus
casei, Lactobacillus acidophilus and Lactobacillus plantarum on the growth performance of broilers.
The
specific objectives of the study are as follows:
1. To determine the effect of different probiotics on the growth
performance of broiler in terms of weight gain, feed conversion efficiency, amount of feed consumed and volume of water consumed.
2. To determine the incidence of diseases.
3. To determine the cost and return in broiler production with the use of probiotics
Hypothesis of the Study
There is no significant effect on the growth performance of broiler using the three (3) different kinds
of probiotics in the drinking water in terms of feed consumption, feed efficiency, and feed consume ratio, weight gain and
water intake.
Scope and Limitations of the Study
The study will focus on the growth performance of broiler supplemented with three (3) different probiotics,
Lactobacillus casei, Lactobacillus acidophilus and Lactobacillus plantarum. Weight gain of chicks, feed consumption, water
intake, feed conversion efficiency and mortality rate will be recorded. Also, net income will be determined and analyzed.
The data on carcass yield, meat cut and intestinal pH will not be gathered. Drinking water will be supplemented with probiotics
preparation in the form of solution.
A total of 96 day old broiler chicks will be reared under hygienic management practice throughout the
entire of the study.
Review of Related Literature
To support this research work and to provide readers with essential information, related literature
and studies about the incorporation of probiotics in drinking water for chicks were reviewed to determine its effectiveness
to the study.
Beneficial Effect of Probiotics
The major consumption
of probiotics is in the form if tablet or powder but most commonly in dairy based food containing intestinal species of Lactobacilli
and Bifidobacterium. Probiotics will be referred to as supplement of animal feeds for farm animals but it is easily applied
to humans. The are many companies and scientists that showed interest in establishing scientific credibility in probiotics
A Nobel- prize winner,
Ellie Metchnikoff (1845-1916) is considered to have been the inventor of probiotics. He was the first one who suggested that
consuming bacteria could have a beneficial effect on health. He proposed that the acid producing organisms in fermented dairy
product could prevent what he called “fouling’’ in the large intestine and , if consumed regularly it will lead to longer , healthier life. Bonci
(2004)
Probiotics in Animal
Modern rearing method
which includes unnatural rearing condition and diet induce stress and can cause changes in the composition of the microflora
which compromise the animals’ resistance to infection. The aim of the probiotics approach is to repair the deficiencies
in the microflora and restore the animals’ resistance to disease. Such treatment does not introduce any foreign chemicals
into the animal’s internal environment and does not introduce any foreign chemical into the animal’s internal
environment and does not run the risk of contaminating the carcass and introducing hazardous chemical into the food chain.
Probiotics are now replacing
the chemical growth promoter for farm animals and claim have also been made for increasing resistance to disease. The benefits
claimed for probiotics in farm animals increased growth rate, improved feed conversion, improved resistance to disease improved
milk yield and quality and improved egg production, Fuller (2004)
Lactobacillus acidophilus
Lactobacillus acidophilus
may be considered a probiotic or “friendly” bacteria. This type of healthy bacteria inhibits the intestine and
vagina which protect against some unhealthy organisms. The breakdown of nutrient by Lactobacillus acidophilus produce lactic
acid, hydrogen peroxide and other byproduct that make the environment hostile for undesired organism Lactobacillus acidophilus
also tends to consume the nutrients other microorganism depend on, thus outcompeting possibly harmful bacteria in digestive
tract. During digestion, Lactobacillus acidophilus also assists in the production of macin, folic acid and pyridoxine L. acidophilus
can also assist in bile deconjugation, separating amino acid from bile, which can then be recycled by the body.
Some research have indicated
Lactobacillus acidophilus that it may provide additional health benefits including improved gastrointestinal function, boosted
immune system and decreased in the frequency of vaginal yeast infection. Some people reported that Lactobacillus acidophilus
provides relief from indigestion and diarrhea. University of Nebraska study found that feed supplement with Lactobacillus
acidophilus and fed to cattle resulted in 61% reduction of Escherichia coli. Research has indicated Lactobacillus acidophilus
helpful in producing serum cholesterol level (http://eu.wikipedia.org/Lactobacillus _acidophilus).
In vivo administration
of Lactobacillus acidophilus improved growth performance of weaning pig was observed. Additionally Lactobacillus acidophilus
works as probiotic which increases the number of desirable microflora in the gut by decreasing intestinal pH. Reports stated
that Lactobacillus acidophilus increased ADG and feed efficiency of pig fed diet supplemented by lactose. http://www.ansi.okstete.edu/reseach/2001rr/42/.42.htm
Lactobacillus casei
Lactobacillus casei is
a transient, anaerobic microorganism of genus Lactobacillus found in the human intestine and mouth. As a lactic acid producer,
it assisted in the propagation of desirable bacteria. This particular species of Lactobacillus is documented to have a wide
pH and temperature range and complement the growth of Lactobacillus acidophilus, a producer of the enzyme amylase. It is known
to improve digestion and to reduce milk intolerance.
The most common application
of Lactobacillus casei is industrial specifically for dairy production; however, a team of scientist from Simon Bolivar University,
Caracas, Venezuela found out that Lactobacillus casei bacterium in bean natural fermentation, the bean contains lower amount
of the compounds causing flatulence upon digestion (http://eu.wikipedia.org//Lactobacillus_casei)
According to Consinagdo
(1992), stated in his study that he did an experimental to determine the antibacterial activity of common diarrhea using ETEC,
Lactobacillus casei against Salmonella enteritidis, Shigella dysenteriae, Vibrio cholerae and to determine the effective contact
that Lactobacillus casei exerts bacterial activity against these organisms.
Thus, clinical study
using Lactobacillus casei as adjunctive or primary management of diarrhea due to mentioned pathogen is highly recommended.
Lactobacillus plantarum
Lactobacillus plantarum has one of the largest genomes known among the lactic acid bacteria and is
very flexible versatile species. Lactobacillus plantarum which is related to lactbacilli is unusual in that it can respire
oxygen but has no respiratory chain. The consumed oxygen ultimately ends up as hydrogen peroxide. The peroxide probably acts
a weapon to exclude completing bacteria from the food source. In place of the protective enzyme superoxide dismutase is present
in almost oxygen-tolerant cell. The organism accumulates millimolar quantities of manganese polyphosphate. Because of chemistry
which manganese compreses protects the cell from oxygen damage is subverted by iron. These cells contain virtually no iron
atom; In contrast a cell of Escherichia coli of comparable volume contain over one million iron atom.
Lactobacillus plantarum is the most common bacterium used in silage inoculants.
The study of Mogol (2006) revealed that the use of 20ml/1 liter of probiotics Lactobacillus plantarum
as supplement gave the highest weight gain in birds.
Methods
Experimental Design
A Randomized Complete Block Design (RCBD) will be used in this study. The weight of the chicks will
served as the determinant factor in assigning into them to different blocks. There will be four treatment assigned to be assigned
in each block.
The treatments to be added to chick’s drinking water are follows
T1= 1000ml water
T2= 1000ml water+ 20 ml Lactobacillus acidophilus
T3= 1000ml water+ 20 ml Lactobacillus casei
T4= 1000ml water+ 20 ml Lactobacillus plantarum
Preparation of Equipment and Facilities
All the needed equipment and facilities that will be used in the study will be prepared a week before
the arrival of the chicks. The poultry house will be cleaned off from dust and foreign matters. The experimental cages, brooder, feeding troughs, waterer and other equipment will be cleaned using washing
with soap and water. After washing, the material will be disinfected using disinfectant.
Procurement of Stock
The ninety- six (96) heads of one-day-old chicks will be purchased from reputable distributor in Pinamalayan,
Oriental Mindoro. The chicks will be placed in a clean box with holes and will be provided with enough space to ensure their
comfort are to avoid from injuries due to overcrowding that may occur during travel.
Brooding
Upon arrival the chicks will be
brooded immediately for two weeks. At this period, brooder will be provided with four 50 watt incandescent bulbs to keep their
bodies warm and comfortable. Clean old newspaper will be laid in the floor to conserve heat and to serve as surface where
feeds will be placed. When temperature gets high, the birds or chicks will open their beak and will spread their wings. Eating
habit will be lessened and will remain inactive. In this condition the temperature will be adjusted downward. When chicks
crowded together, the source of heat will be lowered to decrease the temperature. During brownouts, kerosene lamps will be
used as source of light and heat.
Feeding Management during Brooding
During brooding stage, the chicks will be provided with Water and Commercial feeds in ad libitum way.
The chicks will be fed with chick booster with drinking water for the first two weeks and will be provided with electrolytes,
this will be done at 6:00 A.M. daily.
Distribution of chick to respective cages
Initial weight of chicks will be gathered right after the brooding period. The weight of chicks will
be ranked in descending order. The first 24 heaviest chicks will be randomly assigned at to the four cages in Block I. Rank
25-48 will be assigned to the Block II. Same procedure will be done in assigning birds ranked 49-72 and 73-96 for Block III
and IV respectively.
Feeding of experimental birds
Feeding of broiler starter crumble will start during the growing period until two weeks. After 30 days
of brooding broiler finisher will be given up to the end of the study.
Supplying of Water to the Experimental Birds
Birds in treatment will be given 1000 ml of pure water and the rest will be incorporated with 20 ml
Lactobacillus acidophilus, 20 ml, Lactobacillus casei, 20 ml, Lactobacillus plantarum and to given ad libitum. This will be
done until the end of the experiment.
Lightning Management
During the third week (growing stage) the chicks will be provided with light from electrical source
from 6p.m.-6a.m. using 50 watt incandescent bulb to stimulate feeding at night, protect them from predator and maximize weight
gain. Kerosene lamps will be provided during brownout.
Gathering of Data
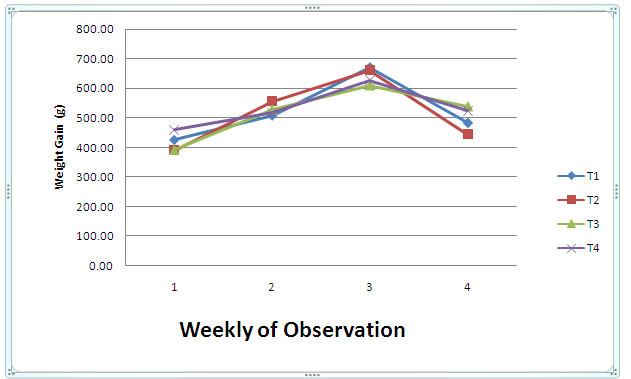
Body Weight
The initial weight of birds will be determined at the end of the brooding period. Subsequent weighing
will be done weekly in the morning before feeding the bird. The body weight gain of the experimental birds will be obtained
by subtracting the first week’s weight. This system of the body weight gain will be continued up to the end of the feeding
experiment.
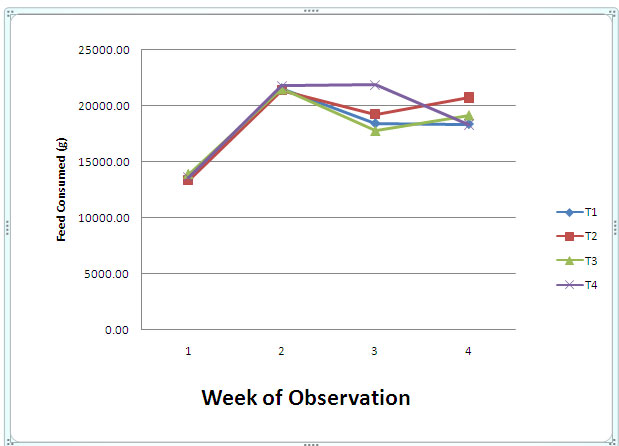
Feed Consumption
All leftover feeds will be weighed and the weight obtained will be subtracted from the daily feed given
to the birds. The difference will be recorded as daily feed intake.
Amount of Water Consumed
With the use of graduated cylinder, all unconsumed water will be measured and subtracted from the water
given daily to the birds. The difference will be noted as daily water intake and will be recorded weekly. Recording of water
intake will start after breeding.
Feed Conversion Ratio
The feed conversion ratio per treatment will be obtained by dividing the average feeds consumed by
the average weight gain of birds times one hundred which will be done weekly until the end of the experiment.
Feed Conversion Efficiency
The feed efficiency per treatment will be obtained by dividing the total weight of feeds consumed
by the total weight gain of feeds
Morbidity and Mortality
In getting the mortality rate of broiler, the number of dead birds will be recorded. Likewise,
the number of those showing illness will be recorded throughout the duration of the study.
The percentage of morbidity per treatment will be computed
by dividing the number of broilers that acquired disease during the experiment by the number of broilers per treatment and
multiplying the value by 100. Percentages of mortality per treatment will be computed by dividing the number of dead broilers
by the number of broiler per treatment and multiplied by 100.
Analysis of Data
The data gathered will be analyzed using analysis of Variance (ANOVA) for the Randomized Complete Block
Design (RCBD) and will be tested at 1% and 5% levels of significance. Duncan’s Multiple Range Test (DMRT) will be used
to determine the significance among treatment means.
RESULT AND DISCUSSION
Average Initial Weight
A total of 96 day-old chicks were used. Before the chicks were transferred to their respective experimental cages after
the brooding period, they were grouped according to their initial weight which served as the blocking factor. Weight gain
of birds was the basis of determining the growth performance.
Table 1. shows the averages initial weight of birds. There was a big difference in
variation observed in the body weight of birds among the treatments Birds supplied with 1000 H2O+ 20ml acidophilus(T2)
in the drinking water gained an average 0f 344.17 compared to birds given only
1000 H2O+ 20ml casei (T3) in their drinking water with a numerical difference
of 67.916g. However, when data were subjected to ANOVA test no significant difference variation was observed (Table1.1) The
significant difference among block was result process of classifying birds into blocks in accordance with their weight. The
highest weight was assigned in Block I and the lowest weight was assigned in block IV.